
Poker Preflop Charts: Opening Ranges by Position
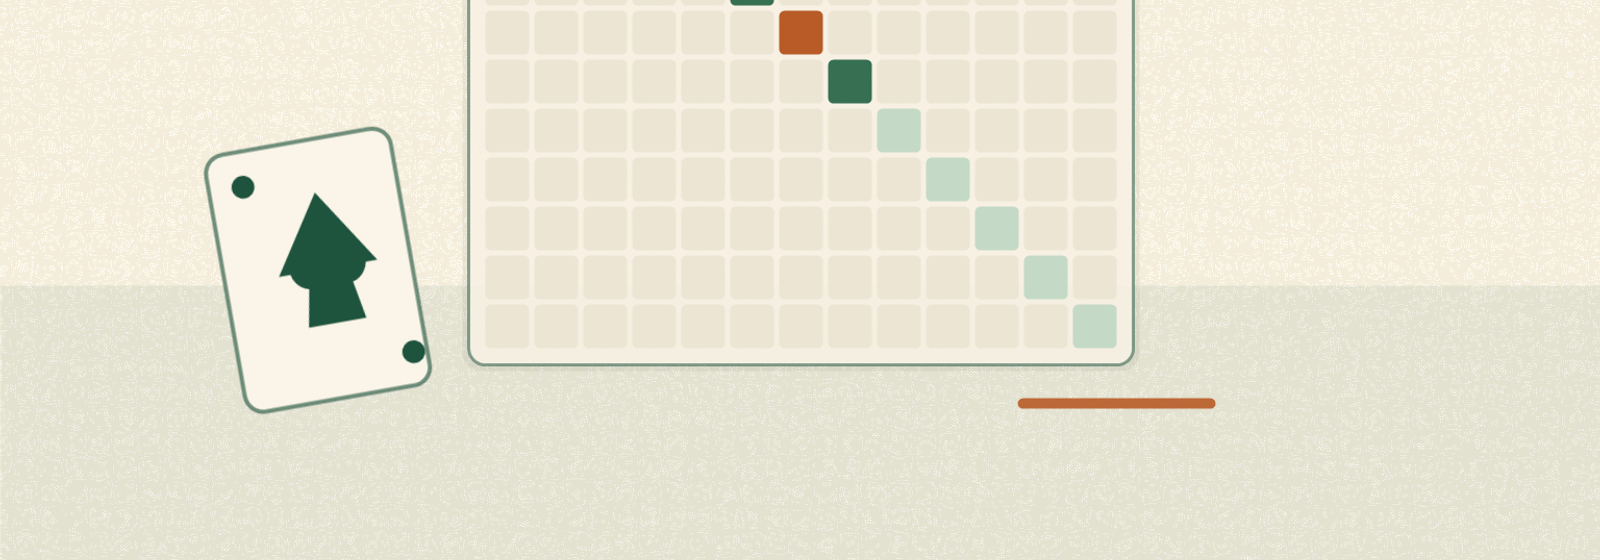
Preflop charts are the single fastest way for a learning player to stop leaking chips before the flop is even dealt. These color-coded grids tell you which hands to open, call, or fold from every seat at the table, and they encode thousands of hours of solver work into something you can read in a glance. Master the logic behind them and you build a foundation that every other street is built on.
What Preflop Charts Actually Are
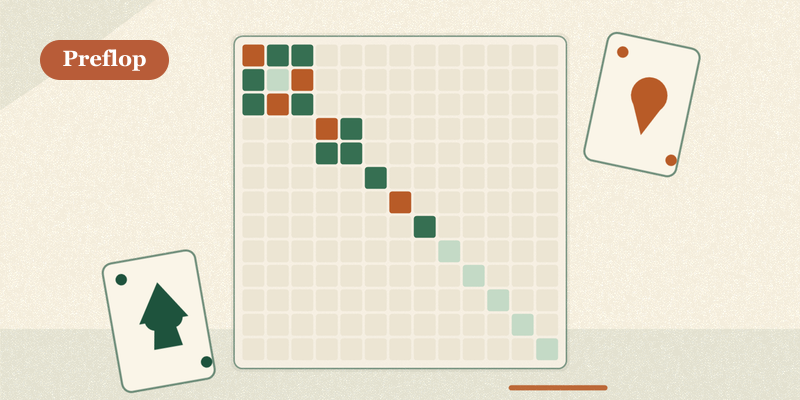
A preflop chart is a 13x13 grid of all 169 possible starting hand combinations. Suited hands sit above the diagonal, offsuit hands below, and the pairs run down the middle. Each cell is colored to show the recommended action: raise, call, or fold. If you have ever seen a starting hands chart, the layout is identical, but preflop charts go further by assigning a specific action to each hand from each position.
The key word is ranges. You are never playing a single hand in isolation. You are playing the entire set of hands you would open from a given seat, and your opponents are doing the same. Thinking in ranges instead of individual cards is the mental shift that separates winning players from the rest.
Why Position Dictates How Wide You Play
The reason charts change from seat to seat comes down to one factor: position. Position is the order in which players act, and acting later is a permanent structural advantage. When you open from an early seat, every player behind you can wake up with a monster. When you open from the button, only the two blinds can fight back, and you will have the last word on every street after the flop.
That extra information and control means you can profitably play far more hands the later you sit. The progression looks like this:
- Early position (UTG): very tight, roughly the top 10 to 15 percent of hands.
- Middle position: a little looser, adding more broadways and pairs.
- Cutoff: noticeably wider, around a quarter of all hands.
- Button: the widest opening range at the table, often 40 percent or more.
The button can open more than three times as many hands as UTG, and that is not a quirk. It is the single most important pattern in all of preflop poker.
Walking the Range From UTG to the Button
The cleanest way to internalize charts is to picture which hand groups get added as you move around the table.
Early position: premiums only
From under the gun you open the hands that play well against many opponents and hold up out of position. That means:
- Big pairs: aces, kings, queens, jacks, tens.
- Strong aces: ace-king and ace-queen, suited and offsuit.
- A handful of suited broadways like king-queen suited.
These hands are always in your range from every seat. They are the bedrock. Notice what is missing: small suited connectors and weak aces are folds here because the table behind you is too dangerous and you will often be out of position.
Middle position and cutoff: filling in the gaps
As the danger behind you shrinks, you start adding hands that need a little more room to be profitable:
- Smaller pairs (nines down to fives and lower).
- More suited broadways and suited aces.
- The first suited connectors, like nine-eight suited.
Button: open it up
On the button you add the speculative hands that thrive when you have position guaranteed:
- Small suited connectors and one-gappers.
- Suited gappers and weak suited aces.
- Many offsuit broadways and offsuit aces that were folds earlier.
A quick comparison makes the point concrete:
| Hand | UTG | Button |
|---|---|---|
| AA, AK | Raise | Raise |
| 99 | Raise | Raise |
| 76s | Fold | Raise |
| K9o | Fold | Raise |
| A5o | Fold | Raise |
Same two cards, opposite decisions, and the only thing that changed is where you are sitting.
3-Bet and Flat-Calling Ranges
Opening is only half the picture. When someone raises in front of you, your chart splits your continuing hands into two buckets: raising again (3-betting) and just calling (flatting).
A solid 3-betting range is usually built from two parts:
- Value hands you are happy to get chips in with, like big pairs and ace-king.
- Bluffs that block your opponent’s strong hands or play well when called, such as suited aces and suited connectors at the bottom of your range.
Flat-calling ranges are more situational. In position you might flat medium pairs and suited broadways that flop well and keep weaker hands in the pot. Out of position, calling gets riskier, so charts tend to push more hands toward folding or 3-betting instead.
Defending the blinds
The blinds deserve special mention. Because you already have money in the pot, you get a discount to continue, so blind defense ranges are wider than a normal calling range. The big blind in particular defends a large slice of hands against a single raise, especially against late-position opens where the raiser’s range is weak. Just remember you will be out of position postflop, so calling wide is not a license to play badly after the flop.
Charts Are a Starting Point, Not the Finish Line
Here is the trap. A chart tells you what to do, but it never tells you why, and it assumes opponents who play perfectly. Real tables are full of players who fold too much, call too much, or never bluff. Against them, the chart-perfect play is rarely the most profitable one.
The charts you study are built on GTO baselines, a game-theory-optimal foundation that is unexploitable but not maximally profitable against flawed opponents. To actually print money you have to deviate, and deviating well requires understanding the underlying logic of range versus range interaction: how your whole range connects with boards, where your equity comes from, and which hands you can afford to fold.
A few principles to carry beyond the grid:
- Learn the why. Ask why a hand is a raise. If you cannot explain it, you cannot adjust it.
- Drill repetition. Charts only help when recall is automatic at the table, not after a 20-second think.
- Practice deviations. The real edge is knowing when to widen against a nit or tighten against a maniac.
This is where focused training pays off. DEEPFOLD drills preflop ranges and the deviations charts cannot teach, turning static grids into instinct and showing you how to exploit the specific mistakes in front of you. You can explore it at https://deepfold.co.
The Bottom Line
Preflop charts give you a reliable, mathematically sound default for every seat, and learning them in the tight-to-loose, UTG-to-button progression will instantly tighten up your game. Treat them as the alphabet, not the whole language. Memorize the baseline, understand why each hand earns its place, and then drill the deviations that separate a chart-follower from a player who genuinely reads the table.
Frequently Asked Questions
What are poker preflop charts and how do you read them?
Preflop charts are color-coded 13x13 grids covering all 169 starting hand combinations, with suited hands above the diagonal, offsuit below, and pairs down the middle. Each cell is colored to show the recommended action, raise, call, or fold, for a given seat, so you can read the correct play at a glance.
Why do preflop charts change depending on your position?
Position is the order in which players act, and acting later is a permanent structural advantage because fewer players can fight back and you get the last word after the flop. That extra information and control means you can profitably open far more hands the later you sit, so each seat has its own chart.
How many more hands can you open on the button versus UTG?
UTG is very tight at roughly the top 10 to 15 percent of hands, while the button is the widest range at the table, often 40 percent or more. The button can open more than three times as many hands as UTG, which is the single most important pattern in preflop poker.
Are preflop charts enough to win, or do you need more?
Charts give a mathematically sound default for every seat, but they are built on GTO baselines that are unexploitable rather than maximally profitable against flawed opponents. To actually profit you have to learn why each hand earns its place and practice deviating against players who fold too much, call too much, or never bluff.
Keep learning
3-Betting Preflop: Building a Range That Prints Money
What a 3-bet is, why a polarized vs linear range matters by position, sizing, and how to stop folding to 4-bets when you should jam.
Read lesson →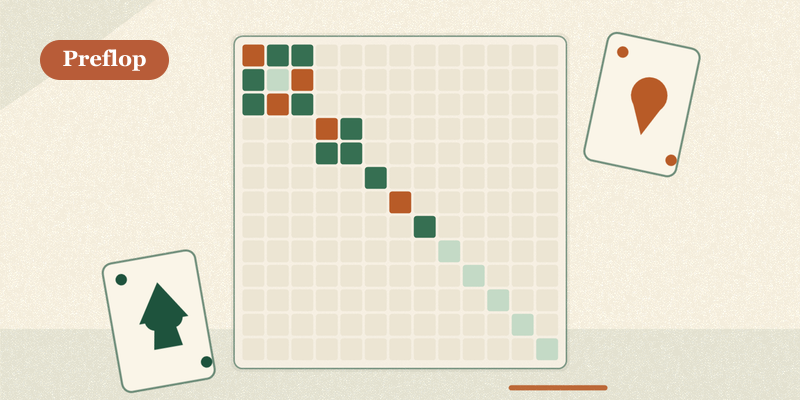
Poker Starting Hands: A Simple Chart for Beginners
Which hands to play and which to fold before the flop, a no-nonsense starting-hand chart and how to adjust it by position.
Read lesson →
Poker Tilt: How to Recognize It and Stop It Costing You
What tilt is, the common types, why it quietly turns winning players into losing ones, how to spot your own tilt early, and concrete techniques to shut it down.
Read lesson →